Stream Gauge Monitoring Tools
Zone 7 streamtracker Tool
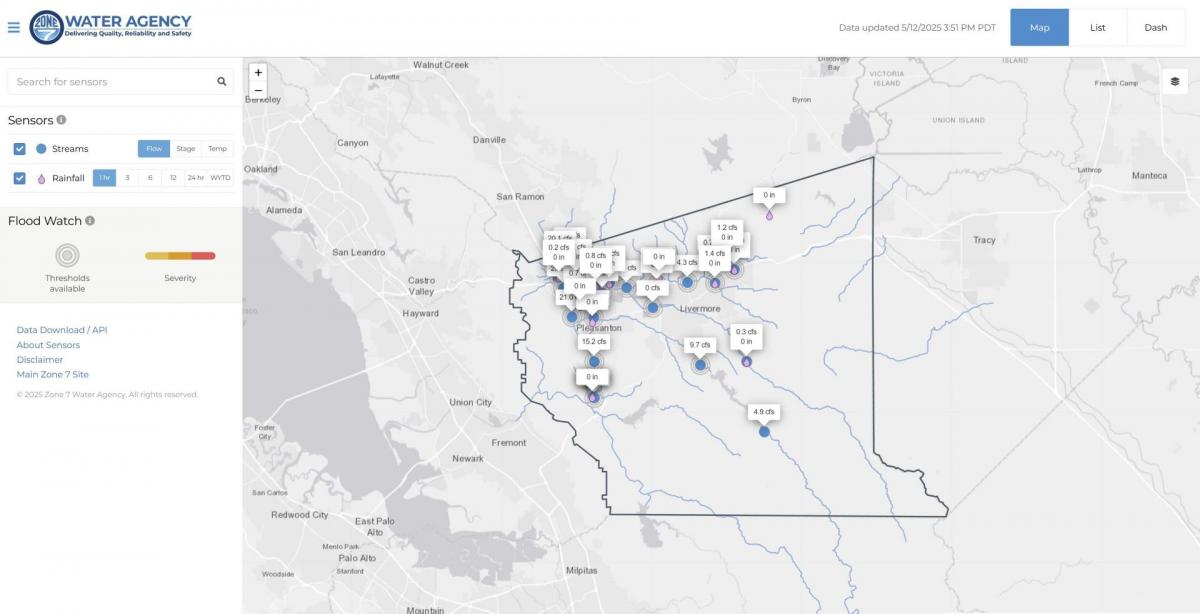
Zone 7 maintains a network of stream gauges in the Service Area; real time data is available for viewing in the StreamTracker tool. Data gaps and errors may exist in the dataset and users should exercise caution.
Steps to view data:
1. Open a browser and navigate to: https://streamtracker.zone7water.com, and select the Streamflow or Rainfall Sensor Data within the StreamTracker’s Map View , List View , or Dashboard View pages. StreamTracker displays available data for active sensors collected at fixed intervals (every 15-mins or 1-hour). There may be occasional delays in the data updates.
2. Options for choosing the gauge of interest:
- Interact with the map and click on the stream or rainfall icon
- By the top left, search by the station name or a channel name in the search bar
- By the top right, click on the “List View” button and scroll through the data table
- By the top right, click on the “Dashboard View” button and scroll through the charts
- By the top left, filter the categorized data within the Map and List views.
3. Options after you make your gauge site selection:
- Click view the individual stream and rainfall graphs (some gauges have stream only data, rain only data, or a combination of both)
- Input a period of interest above chart at the date start/end input field
- Zoom into the chart by a click, drag, and highlight
- By the top left, click between the station’s “Table” and “Information” tabs above the graph
- By the top right, click on the hamburger button for chart download options
- By the top right, toggle on/off the colored Flood Watch Thresholds to view the different water levels to be aware of (stream gauges only)
- To download data, navigate to the StreamTracker’s “Data Download /API” page link located on the main StreamTracker page (left bar).
To download data, navigate to the StreamTracker’s “Data Download /API” page link located on the main StreamTracker page (left bar).
If there questions or comments about the web portal, email zone7communications@zone7water.com.
USGS Gauge Data – Online Dashboard Tool
USGS maintains a network of stream gauges in the National Water Information System; real time data is viewable through an online Dashboard tool. Please note that this website may contain links or references to external websites that are not provided or maintained by, or in any way affiliated with Zone 7.
Steps to view data:
1. Open a browser and navigate to: https://dashboard.waterdata.usgs.gov/
2. On the map, find and choose the gauge of interest by either
3. Scroll down to “Discharge, cubic feet per second” or to “Gauge height, feet” to display the graph of your choice.
Options after you make your gauge site selection:
NoAA NWPS station forecast – Online Dashboard Tool
Stream forecast tools are also available at select locations, courtesy of NOAA’s National Water Prediction Service (NWPS), and are based on future weather conditions. Stream Forecasts may be highly variable and should be used with caution. Please note that this website may contain links or references to external websites that are not provided or maintained by, or in any way affiliated with Zone 7.
Steps to view data:
1. Open a browser and navigate to: https://water.noaa.gov
2. On the US map, find and choose the gauge of interest by either
3. View the current observed data and the predicted forecast data for the selected gauge or enter the “full gauge page” link for additional gauge information.
4. Options after you make your gauge site selection:
a) Interact with the chart and zoom to desired date/time scale